“Remember that time is money,” the United States inventor, businessman and politician Benjamin Franklin famously wrote in an essay published in 1748 titled
Advice to a young tradesman.
Franklin’s point 275 years ago was that he believed there is often a financial cost when someone wastes time or delays taking action.
Delays in taking action can have a cost. But, when it comes to investing, long-term financial success is generally about time, not specific timing.
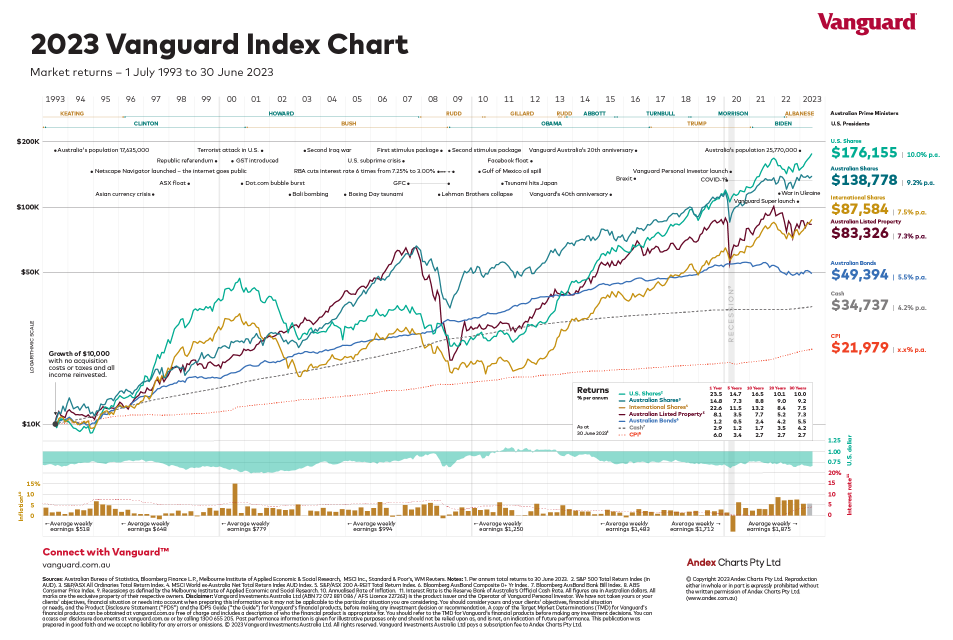
To this point, the annual Vanguard Index Chart provides some important clues. It tracks the total investment returns over 30 years of six major asset classes – Australian shares, United States shares, international shares (excluding Australian shares), listed Australian property securities, Australian bond securities, and cash.
The 2023 Vanguard Index Chart below covers the period from 1 July 1993 to 30 June 2023 and shows how a starting balance of $10,000 would have changed in value after being invested into each asset class via broad market index funds such as exchange traded funds (ETFs).
 Click here
 to view the Index Chart.
The dollar and percentage numbers in the chart represent total investment returns. That is, they assume all investment income earned from an investment fund over time was reinvested back into the same fund. The numbers also exclude investment fees or taxes.
Without the benefit of 20:20 hindsight, trying to pick the “best” time to start investing over the last 30 years would have been extremely difficult. That’s because markets move up and down during every trading session, so trying to pick market highs and lows is virtually impossible.
But what’s clear is that each of the asset classes shown on the chart increased substantially over the 30 years to the end of June 2023, and some more than others.
How different asset classes performed1
U.S. shares
With an average total annual return of 10%, a $10,000 investment in the top 500 U.S. companies at 1 July 1993, when measured by the S&P 500 Total Return Index (in Australians dollars), would have grown to $176,155 by 30 June 2023. That’s a total compound return of more than 1,660% without an investor making any additional investments beyond the initial $10,000 in 1993, other than by reinvesting all the income distributions that they received over time.
Australian shares
A $10,000 investment in the Australian share market over the same time period, when measured by the S&P/ASX All Ordinaries Total Return Index, would have increased to $138,778 based on the same strategy of reinvesting all the income distributions. That represents a 9.2% per annum average annual return over the 30-year period, and a total compound return of more than 1,280%.
International shares
Invested into international shares (when measured by the MSCI World ex-Australia Net Total Return Index – in Australians dollars), $10,000 would have risen to $87,584 based on the 7.5% average annual return over the period. This represents a total compound return of 776%.
Australian listed property
In Australian listed property securities, when measured by the S&P/ASX 200 A-REIT Total Return Index, a $10,000 investment would have grown to $83,326. This represents an average annual return of 7.3% and a total compound return of 733%.
Australian bonds
Australian bonds, when measured by the Bloomberg AusBond Composite 0+ Yr Index, would have delivered an average annual return of 5.5%, increasing a $10,000 investment almost fivefold to $49,394. This represents a total compound return of 394%.
Cash
The lowest long-term return over three decades has been from cash. When measured by the Bloomberg AusBond Bank Bill Index, it would have earned just 4.2% per annum and grown to $34,737. This is over $140,000 less than an investment in the broad U.S. share market and $104,000 less than an investment in the broad Australian share market. Even still, the total compound return from cash would have been almost 150% based on a $10,000 initial investment.
Four key lessons from the Vanguard Index Chart
- Good investing is about time, not timing. Rather than trying to time the best time to invest, making an initial investment and staying invested, irrespective of short-term events and markets volatility, can deliver smoother returns over the long term. Successful investment strategies don’t happen overnight. They generally take years or even decades to reach fruition.
- Focus on the long term, not short-term events. Investment markets can be volatile at times for a wide range of reasons. Yet it’s clear that investors who have had the confidence to stick to their investment strategy, even during periods of heightened volatility, have achieved positive annualised returns over longer periods.
- Spreading your investments helps reduce the risk of loss. The varied returns from the different asset classes highlights the importance of diversification. The best-performing assets in some years can be the worst-performing in others. Spreading your money over a range of assets can help to smooth out intermittent volatility and achieve more consistent returns over the longer term.
- Higher balances will compound over time. Even a low initial balance can grow substantially over time when combined with compounding investment returns. By following a strategy of reinvesting income distributions over a long period of time, the combination of market growth and compounding returns can deliver strong returns over a long period.
To quote Benjamin Franklin once again: “Lost time is never found again”.
This is true. No one can go back in time to regain missed opportunities. But when it comes to investing, while the historical returns from different asset classes can’t be relived and are not an indicator of their future performance, the benefits of being invested over the long term are clear for all to see.
1Total investment returns and/or increase in value of the initial $10,000 portfolio stated below, for all asset classes, assume reinvestment of all income distributions and do not take into account any investment fees incurred.